Teehan+Lax definition of a design-driven company:
• A demonstrated care in the design of their products and Web site
• A history of innovation
• They inspire loyalty in their customer base
• Doing business with them is a positive experience

Daring to convert to design-driven development is sometimes seen as financial risk-taking. But many studies show that customer-driven companies are more profitable, and that their stock prices perform significantly better. In this in-depth analysis, we explore the impact of design on financial metrics.
Just over twelve years ago, the Canadian design company Teehan+Lax created UX Fund – a stock portfolio that only invested in design-driven companies. They invested $5,000 in each of ten different companies that they considered design-driven both in terms of the company’s product offerings as well as its website. The companies also had to have a history of innovation and a business model that fostered customer loyalty.
Teehan+Lax definition of a design-driven company:
• A demonstrated care in the design of their products and Web site
• A history of innovation
• They inspire loyalty in their customer base
• Doing business with them is a positive experience
Some of the selected companies may seem surprising twelve years later, but they all met the requirements back in 2006. The portfolio consisted of the following companies: Apple, Google, JetBlue, Netflix, Nike, Progressive Insurance (PI), Target, Yahoo!, RIM (Blackberry), and Electronic Arts (EA).
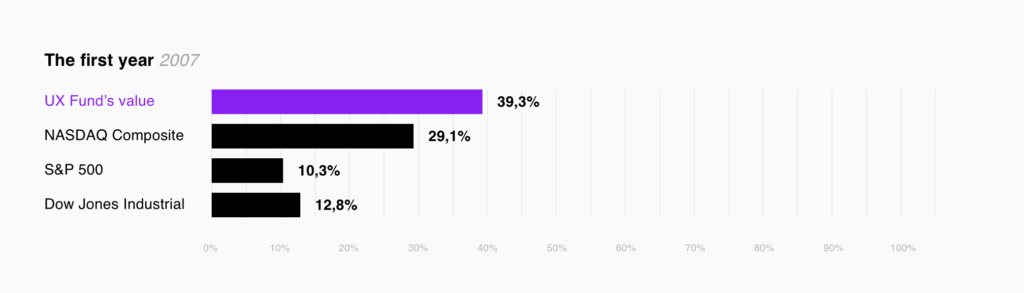
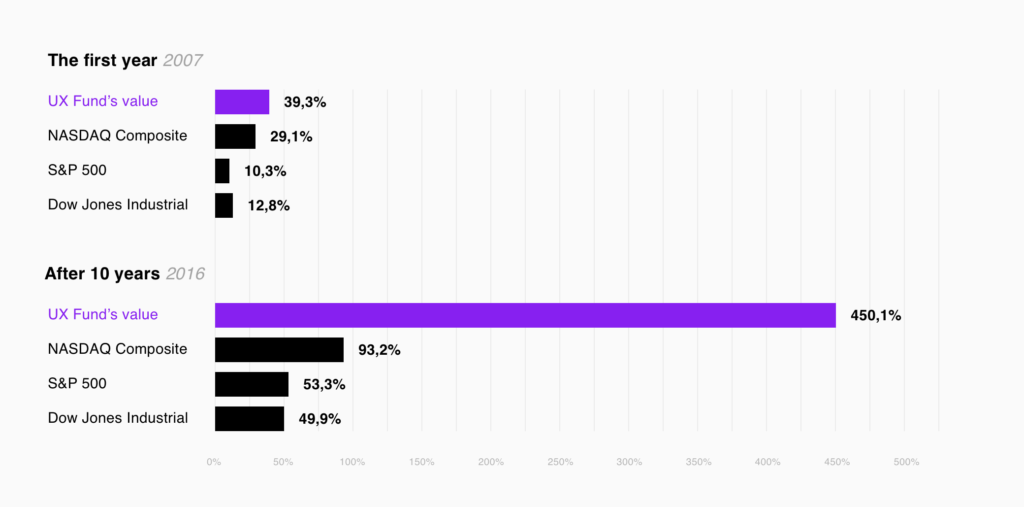
The fund was a great success. In the first year, UX Fund’s value rose by 39.3% and outperformed all three benchmark indices: the NASDAQ Composite (+29.1%), the S&P 500 (+10.3%), and the Dow Jones Industrial Average (+12.8%).
The fund was then sold off after the first year elapsed. In retrospect, that was a mistake, because when following up on what would have been the fund’s progress after ten years, the value had risen by 450.1% and had vastly outperformed the NASDAQ (+93.2%), the S&P (+53.3%), and the Dow (+49.9%).
In November of last year, we decided to generate our own follow-up of UX Fund’s progress on its twelve-year anniversary.
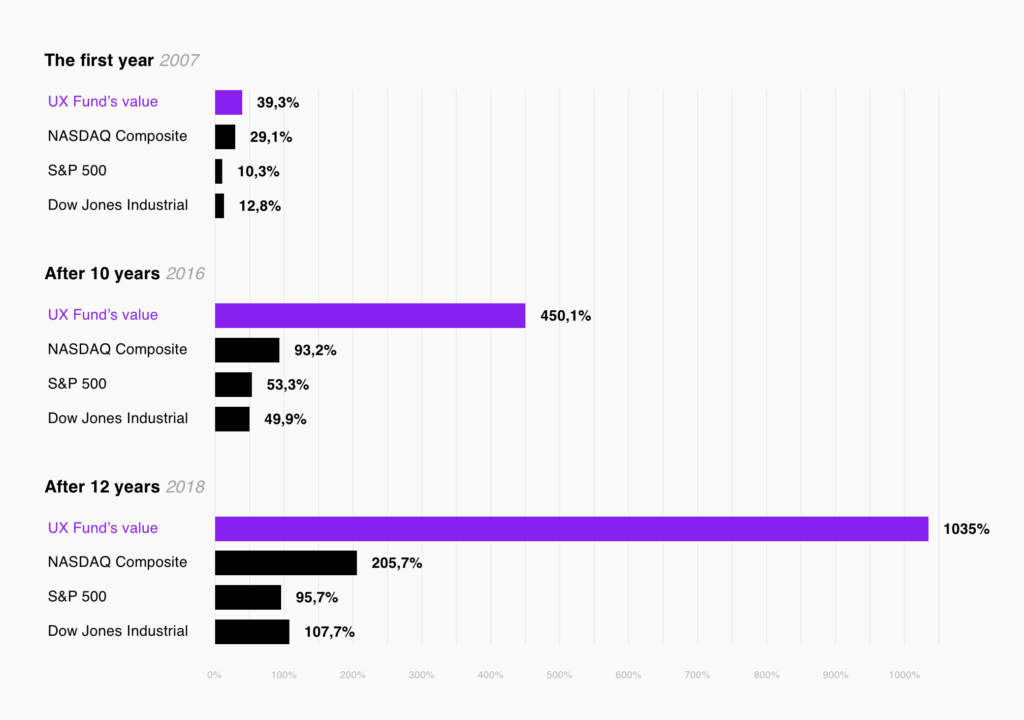
Our analysis shows that the fund’s value over twelve years had increased by 1035%:
|
|
Nov -06 |
Nov -18 |
+/- |
|
Apple |
13.09 |
222.22 |
+1598% |
|
Netflix |
4.1829 |
317.38 |
+7488% |
|
EA |
55.89 |
94.19 |
+69% |
|
|
240.84 |
1070 |
+344% |
|
JetBlue |
13.66 |
17.23 |
+26% |
|
Nike |
12.37 |
76.79 |
+521% |
|
PI |
22.55 |
69.04 |
+206% |
|
Blackberry |
46.28 |
9.53 |
-79% |
|
Yahoo! |
27.01 |
62.86 |
+133% |
|
Target |
58.09 |
84.23 |
+45% |
|
|
|
|
|
|
|
|
Average: |
+1035% |
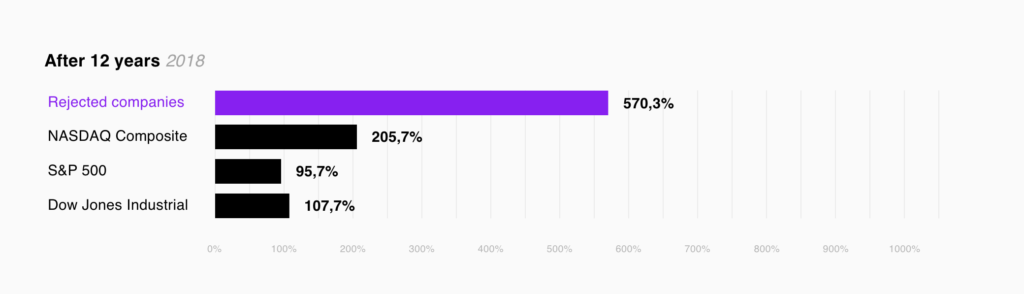
And of course, it outperformed the NASDAQ (+205.7%), the S&P (+95.7%), and the Dow (+107.7%) this time, too:
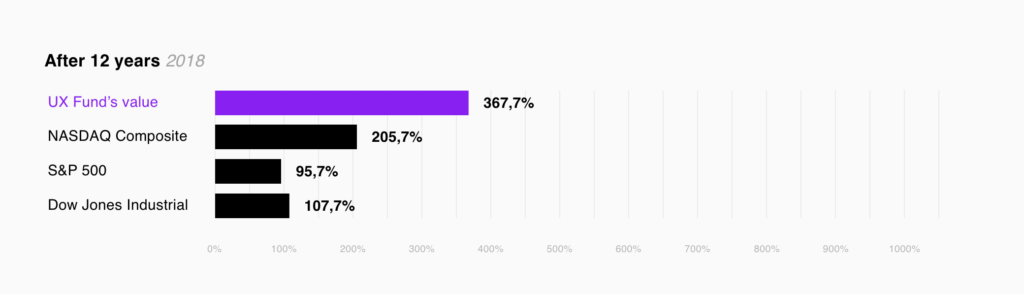
When we excluded the best performing company (Netflix) and the worst performing company (Blackberry), the fund had still risen 367.7% in twelve years, beating out all three benchmark indices:
The value of the fund has thus outperformed the benchmark indices at all three reviews. But not only that; when Teehan+Lax put together the portfolio in 2006, they had a shortlist of other companies that also met their criteria, but which ultimately weren’t chosen. We evaluated these companies, too.
For instance, they considered Cabela’s, an American company that sells equipment for hunting, fishing and outdoor life. Cabela’s was valued at approximately $1.4 billion in 2006. However, at the close of 2016, Bass Pro Shops, a direct competitor (which was also considered for the fund but unfortunately wasn’t publicly traded at the time), bought Cabela’s for $5.8 billion – which means that the company’s value had more than tripled in ten years.
“The value of the fund has outperformed the benchmark indices at all three reviews”
Starwood Hotels was another of the companies considered. In November 2015, it merged with Marriot (Starwood’s market value was roughly the same then as it was in 2006, around $13 billion) and thus created the world’s largest hotel group.
Since Cabela’s and Starwood merged with other companies, we excluded them in our comparison. Companies initially considered but not selected, and not bought or merged with a competitor, developed as follows:
|
|
Nov -06 |
Nov -18 |
+/- |
|
Gucci* |
110.05 |
399 |
+263% |
|
VW |
77.65 |
148.1 |
+91% |
|
Amazon |
43.34 |
1754.91 |
+3949% |
|
eBay |
13.86 |
29.84 |
+115% |
|
Expedia |
36.32 |
125.43 |
+245% |
|
Best Buy |
54.97 |
73.23 |
+33% |
|
Harley D. |
73.77 |
40.86 |
-45% |
|
Tivo |
27.65 |
10.49 |
-62% |
|
SW Air |
15.71 |
52.72 |
+236% |
|
*Kering/PPR |
|
|
|
|
|
|
Average: |
+570% |
Overall, the rejected companies also performed many times greater than all the benchmark indices, with a value increase of 570.3%:
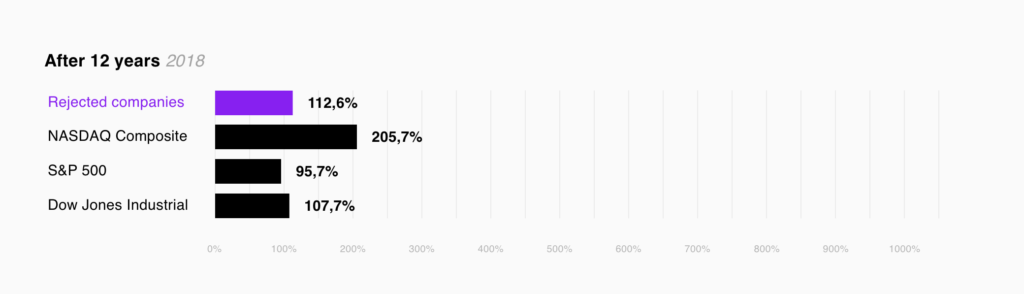
Excluding the best performing company (Amazon) and the worst performing company (Tivo), the value had risen by 112.6% in twelve years. Thus, the fund beat out both the S&P 500 (+95.7%) and the Dow (+107.7%) but was outperformed by the NASDAQ (+205.7%), which had very strong returns from 2016 to 2018:
“The rejected companies also performed many times greater than all the benchmark indices, with a value increase of 570.3%”
When assessing stock values, design-driven companies (as defined by Teehan+Lax in 2006) have been enormously successful. Even when viewing these companies’ financial data, we can see that a focus on design is highly profitable.
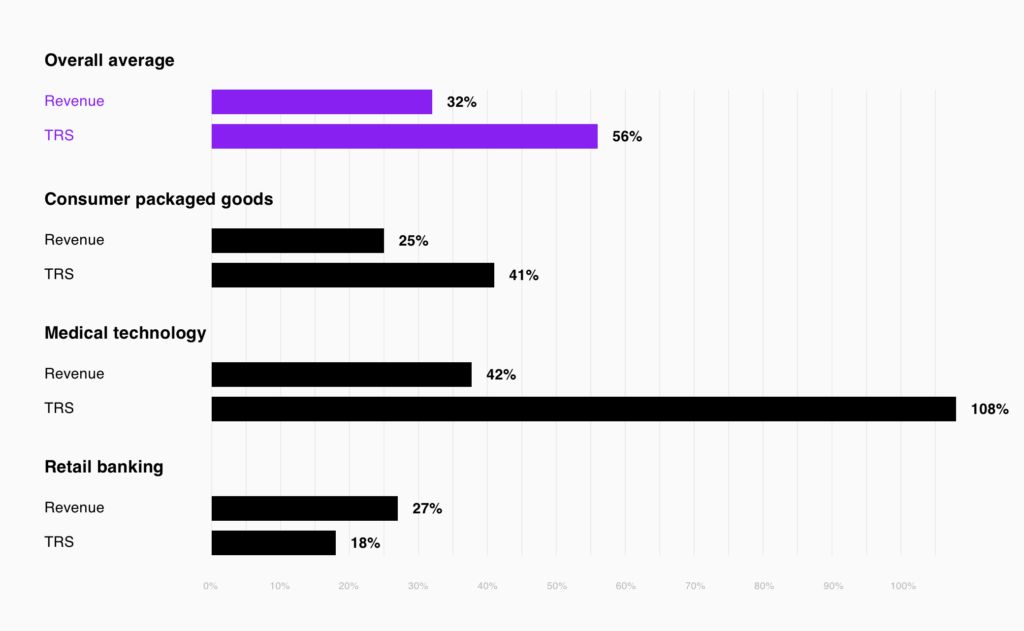
For example, McKinsey released a report in October 2018 that measured design-driven corporate financial performance over a five-year period. The result? The most design-driven companies increased their revenues and total returns to shareholders (TRS) substantially faster than their industry counterparts did over a five-year period: 32 percent higher revenue growth and 56 percent higher TRS growth for the period as a whole.
In the study, McKinsey emphasizes the value of utilizing new methods to create better design. Among other things, they talk about feedback automation, increased access to statistics and analytics, and the value of involving end users in product development. Over 40 percent of the companies surveyed still weren’t talking to their end users during development.
“40 percent of the companies surveyed still weren’t talking to their end users during development”
Besides the general message – that companies who invest in design perform better financially – it was also clear that this conclusion was independent of industry. The study included three industries, all of which are close to our hearts: medical technology, consumer goods, and retail banking. It turned out that the results were consistent across all three industries.
In summary, it’s clear that design-driven companies perform better than their competitors both in the short and the long term. For those of us who use these methods daily, it’s easy to appreciate the value of multidisciplinary project teams, involving end users, working with continuous product development, and so on.
At the same time, we know that not all companies dare to invest in new design-oriented working methods and just get stuck in old wheel tracks; they think it’s too expensive. But as we can see, the daunting initial cost to change the company culture often means a considerable economic advantage both in the short and the long term.
In other words: courage pays off.
We love to write about what we do, what we learn along the way and what we play with.